
finantic.Kalman is an extension package for Wealth-Lab (WL7). The package contains Kalman filters for one and two variables, four indicator families for different applications and a set of coded WL7 strategies which showcase and demonstrate the filters and indicators.
Kalman Filters
In statistics and control theory, Kalman filtering, also known as linear quadratic estimation (LQE), is an algorithm that uses a series of measurements observed over time, containing statistical noise and other inaccuracies, and produces estimates of unknown variables that tend to be more accurate than those based on a single measurement alone, by estimating a joint probability distribution over the variables for each timeframe. The filter is named after Rudolf E. Kálmán, one of the primary developers of its theory.
In a trading strategy the Kalman filter can be used to estimate price, trend or other variables.
WL7 Indicators
Remark: There is a standard WL6 indicator named „Kalman“. This indicator was developed by John Ehlers and has -besides his name- not much in common with the finantic.Kalman package.
Kalman1Price Family
The idea behind this indicator family is the existence of a „true security price“ which is not directly observable but hidden behind a nebula of erratic and irrational price movements.
The KalmanPrice1_Estimate indicator is constructed to estimate this „true price“ and it resembles a moving average with an variable period.
The Kalman1Price Family uses the following models and assumptions:
Measurement: The meaurement is the daily close price.
Measurement Noise: The measurement noise is modeled by an ATR(2) indicator.
Process Noise: The process noise is modeled by an ATR(40) indicator.
The following chart is produced by the WL7 strategy Kalman1Price Demo which part of the finantic.Kalman package:
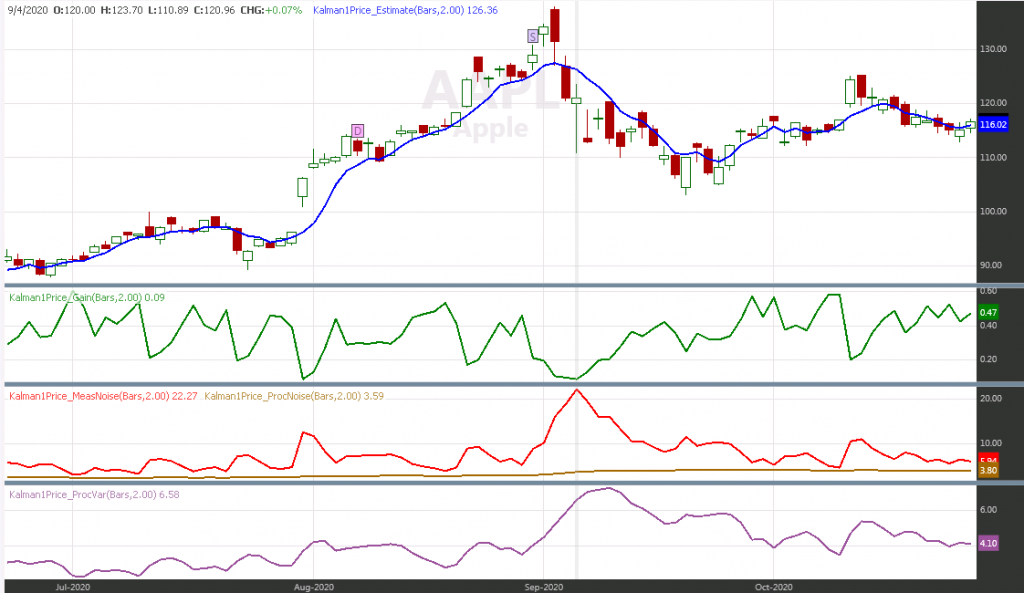
The blue line in the price pane shows the price estimate of the Kaman filter. It is clearly visible how the line follows prices closely if volatility is low. At times with high volatility the blue line is much smoother.
The green line shows the Kalman Gain. The Gain is low at times with high volatility makeinng the filter less responsive to changes in the price series.
The red line shows the measurement noise modelled by an ATR(2) indicator.
The orange line shows process noise modeled by an ATR(40) indicator.
Finally the violet line shows process variance. This can be used to estimate the error in the filter output.
At the core of the Kalman1Price indicator family is the follwing code:
            KalmanFilter1 kf = new KalmanFilter1();

            ATR _atr2 = ATR.Series(bars, 2);
            ATR _atr40 = ATR.Series(bars, 40);

            for (int bar = 0; bar < bars.Count; bar++)
            {
                if (double.IsNaN(_atr2[bar])) continue;
                if (double.IsNaN(_atr40[bar])) continue;
                if (double.IsNaN(bars.Close[bar])) continue;

                double measNoise = _atr2[bar] * meas_f;
                double processNoise = _atr40[bar];

                x_Ser[bar] = kf.Update(bars.Close[bar], measNoise, processNoise);

                K_Ser[bar] = kf.K;
                P_Ser[bar] = Math.Sqrt(kf.P);

                measNoise_Ser[bar] = measNoise;
                procNoise_Ser[bar] = processNoise;
            }
Kalman1Drift Family
The idea behind this indicator family is the existence of a trend behind the visible price movements. In this case trend is defined as the average of daily price changes. We call thois definition „drift“.
The KalmanDrift1_Estimate indicator is constructed to estimate this „drift“.
The Kalman1Drift Family uses the following models and assumptions:
Measurement: The measurement is the daily price change, which is defined as the difference between today’s close price and yesterday’s close price. This value is conveniently calculated by the Momentum(1) indicator.
Measurement Noise: The measurement noise is modeled by an ATR(4) indicator.
Process Noise: The process noise is modeled by an ATR(40) indicator.
The following chart was produced by the WL7 strategy Kalman1Drift Demo which is part of the finantic.Kalman package:
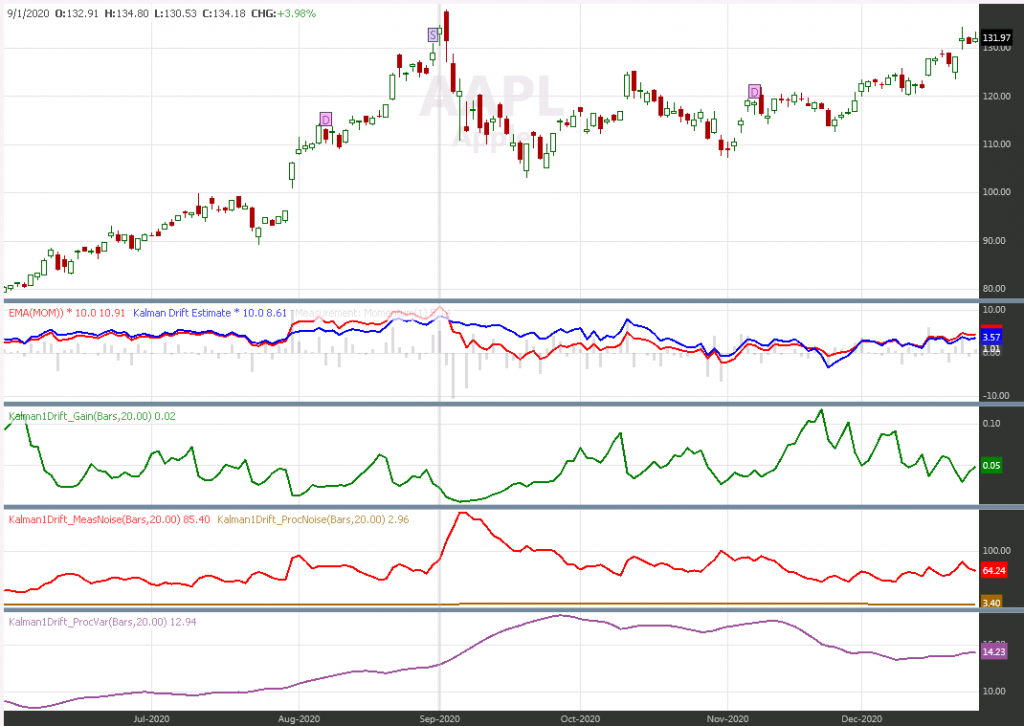
The blue line shows estimated drift. In the same pane, plotted as gray histograms is the underlying measurement modeled by the dayli Clos to Close price changes as calculated by the Momentum(1) indicator. As a benchmark in red we see an EMA(Momentum(1)).
In Times with low volatility, the Kalman gain (green line) is high and the estimated drift follows the trend quite fast, in many cases faster than the red EMA. In times with high volatility the Kalman gain is low and the estimated drift is much smoother than the EMA in red.
At the core of the Kalman1Price indicator family is the follwing code:
           double processF = 1.0;
            KalmanFilter1 kf = new KalmanFilter1();

            // Measurement
            Momentum measSer = Momentum.Series(bars.Close, 1);

            // Measurement Noise
            ATR _atr = ATR.Series(bars, 4);
            TimeSeries measNoise_Ser = _atr * meas_f;

            // Process Noise
            ATR procNoise_Ser = ATR.Series(bars, 40);

            for (int bar = 0; bar < bars.Count; bar++)
            {
                double measNoise = measNoise_Ser[bar];
                double processNoise = processF * procNoise_Ser[bar];
                double meas = measSer[bar];

                if (double.IsNaN(measNoise)) continue;
                if (double.IsNaN(processNoise)) continue;
                if (double.IsNaN(meas)) continue;

                drift_Ser[bar] = kf.Update(meas, measNoise, processNoise);

                double sqrt_P = Math.Sqrt(kf.P);

                K_Ser[bar] = kf.K;
                P_Ser[bar] = sqrt_P;
            }
Kalman1TS Indicator Family
This indicator family is more generic than the preceding families. It takes three TimeSeries as inputs:
Measurement: This TimeSeries represents the measured values.
Measurement Noise: This TimeSeries represents the measurement noise.
Process Noise: This TimeSeries represents the process noise.
It calculates three TimeSeries as results:
Kalman1_Estimate: This TimeSeries is the Kalman Filter’s estimate.
Kalman1_Gain: This TimeSeries contains the internal „Gain“ value of the Kalman Filter.
Kalman1_ProcVar: This TimeSeries contains the estimated process variance as calculated by the Kalman Filter internally.
As an exercise we try to estimate close prices. This time we choose the following models:
Measurement: The close prices
Measurement Noise: The STVola indicator
Process Noise: An averaged version of the STVola indicator: EMA(STVola(), 40)
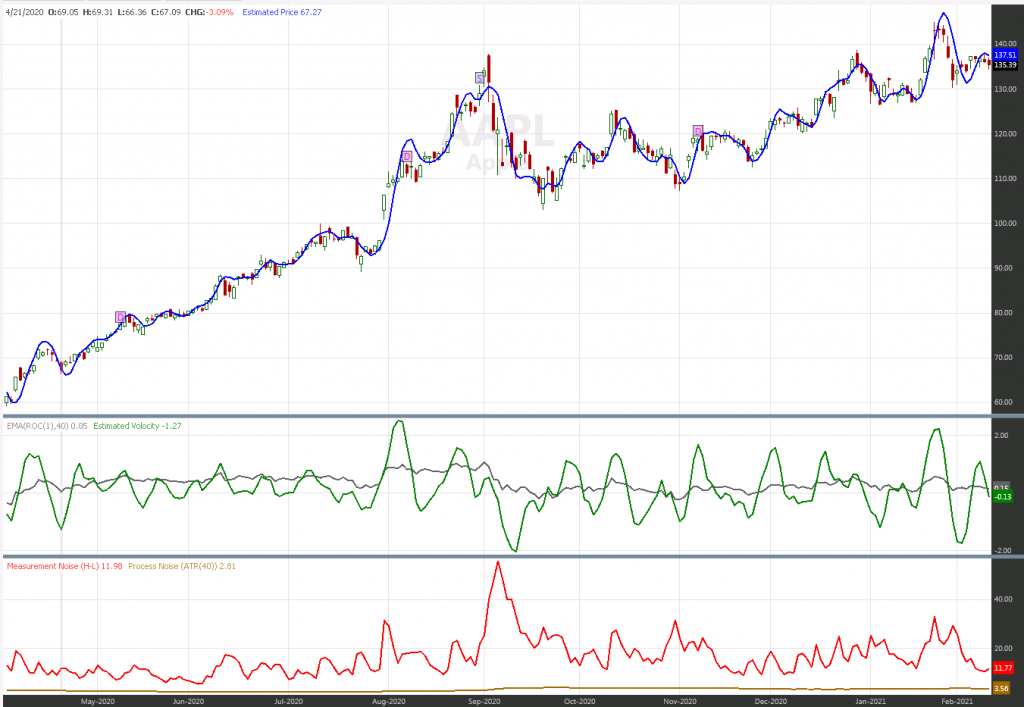
The following chart is produced by the WL7 strategy Kalman1TS Demo which is part of the finantic.Kalman package:
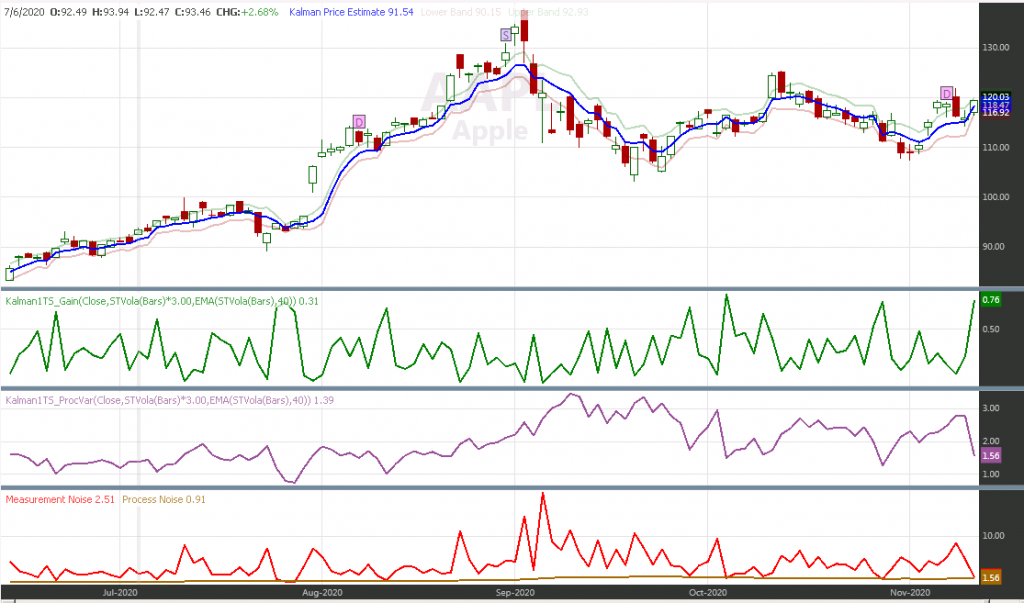
The chart shows the same security at the same time as the chart for the Kalman1Price family above. All colors are the same as above.
This time the maesurement error calculation is much more responsive to Volatility changes in the price series.
At the core of the Kalman1Price indicator family is the follwing code:
         KalmanFilter1 kf = new KalmanFilter1();

            for (int bar = 0; bar < source.Count; bar++)
            {
                if (double.IsNaN(source[bar])) continue;
                if (double.IsNaN(measNoise[bar])) continue;
                if (double.IsNaN(procNoise[bar])) continue;
                estimate_Ser[bar] = kf.Update(source[bar], measNoise[bar], procNoise[bar]);

                K_Ser[bar] = kf.K;
                P_Ser[bar] = Math.Sqrt(kf.P);
            }
Kalman Filter with one Variable
The finnatic.Kalman package is built around two FIlter classes which can also be used directly for special applications.
As an example we estimate the price of a BarHistory again but this time we use two measurements per day: The open price and the close price.
We model the measurement noise with the daily difference between high and low price and process noise as before wit an ATR(4) indicator.
The interesting part of the strategy looks like this:
			double meas_f = 2.0;

			KalmanFilter1 kf = new KalmanFilter1();
			ATR _atr40 = ATR.Series(bars, 40);

			for (int bar = 1; bar < bars.Count; bar++)
			{
				double measNoise = (bars.High[bar] - bars.Low[bar]) * meas_f;
				double processNoise = _atr40[bar-1];
				measNoise_Ser[bar] = measNoise;
				procNoise_Ser[bar] = processNoise;

				if (double.IsNaN(measNoise)) continue;
				if (double.IsNaN(processNoise)) continue;
				if (double.IsNaN(bars.Open[bar])) continue;
				if (double.IsNaN(bars.Close[bar])) continue;

				// todays's Open
				kf.Update(bars.Open[bar], measNoise, processNoise);
				// today's Close
				estimate[bar] = kf.Update(bars.Close[bar], measNoise, processNoise);

				K_Ser[bar] = kf.K;
				P_Ser[bar] = Math.Sqrt(kf.P);
			}
The following chart was generated by the WL7 strategy Kalman1 Filter Demo which is part of the finantic.Kalman package:

Because there are two updates per bar all internal values fluctuate much faster then in the previous examples.
Kalman2 Filter
The Kalman2 filter can be used to estimate price and momentum at the same time.
The follwing chart was generated by the WL7 strategy KalmanFilter2 Price Demo which is part of the finantc.Kalman package.