
finantic.Parameters and Metrics is an Optimization Visualizer Exrension for WealthLab 7. It shows two simple yet powerful graphs which let you understand and interpret the results of an optimization run even if many parameters are involved.
Basic Idea behind the Graphs
The optimizer algorithm uses various parameter combinations as it walks towards an optimal value for it’s target metric. The charts display this walk to the optimum. (Everything is ordered by the target metric) when we go more to the right in the chart, we come closer to our goal: The best value for the target metric
The „Parameter“ pane shows the parameter values tried and used along this way. It may display this history of parameter values, for all parameters, one by one.
How does it work?
The graphs are best explained starting with the Tabular result view of an optimization run in WL7:
Most optimizers try to maximize (or minimize) a given performance metric. In the tabular view we sorted all rows by this metric. In this case the table is ordered by „APR“ as the red arrow suggests. At the same time the „Range“ column shows the associated values for Parameter „Range“ as the green arrow suggests.:

finantic.OptimizationResultVisualizer shows the „APR“ row as a blue line in the lower „Metric“ pane, bad values at the left, good values at the right. The red arrow goes along the same values as in the table above.
The upper pane shows one of the strategy’s parameters (Range) sorted the same way as the metric pane. Bad values for the parameter are left, good values are right. The green arrow goes alongt the same values as the green arrow in the tabular view.

From these Charts it becomes obvious that good values for the „Range“ Parameter are between 20 and 30 as these values correspond with good APR values.
Advanced Use Cases
It is possible to show a second Metric in the lower pane. Please note that the Y-Axis for Metric 2 is on the right side of the chart.
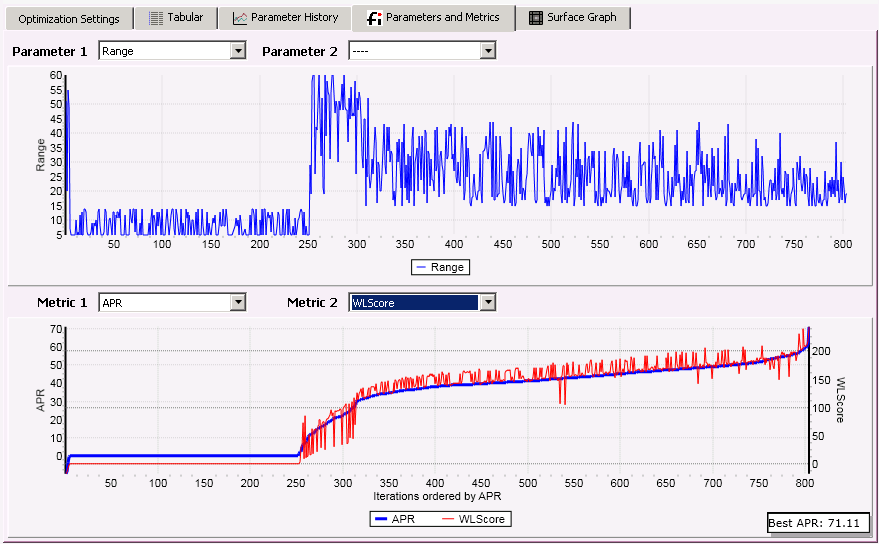
In the picture above we selected „WLScore“ for the second metric „Metric 2“ which is displayed with a red line. It becomes obvious that the metric „WLScore“ gauges the results quite similar to „APR“.
Furthermore it is possible to show a second Parameter in the upper pane. Please note tht the Y-Axis for the second parameter is on the right side of the chart:
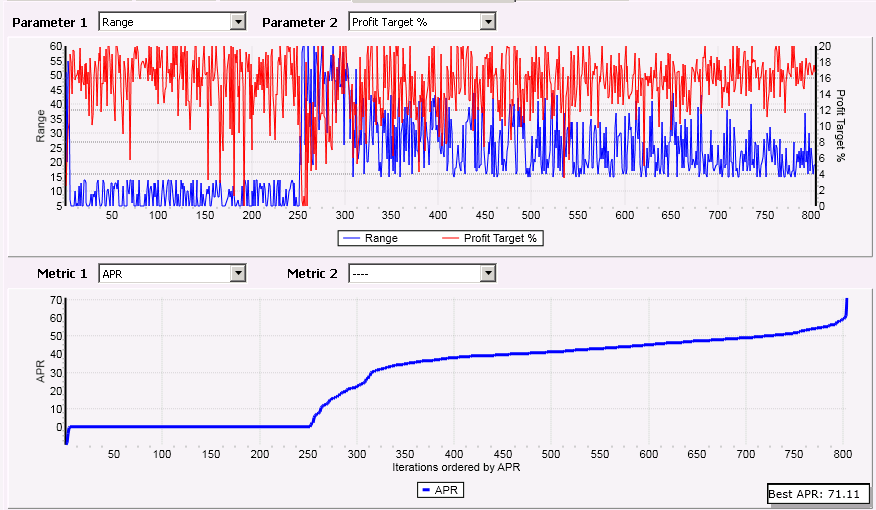
In the picture above we’ve choosen „Profit target %“ as the second parameter. At the right end of the curve we can see, that good values for „Profit Target%“ lie between 15% and 19%.
All examples are produced with the strategy „Opening range breakout“, the „Particle Swarm“ Optimizer and 1000 iterations (which took about 7 Minutes on a Machine with four processors)
Technical Details
The X-Axis is always „Runs ordered by Target Metric“ and the Target Metric is either the „Metric name“ of the Optimizer’s settings“ or the default metric of the active ScoreCard if the optimizer has no target. I’ll have to add this to the documentation.